Accessibility links
Skip to main content
Skip to main Navigation
Skip to Search
Home
United States
U.S. News
All About America
World
Africa
The Americas
East Asia
Europe
Middle East
South & Central Asia
Broadcast Programs
VOA Languages
Latest Global Coverage
Follow Us
Languages
Search
Search
Previous
Next
Breaking News
US News
中文
فارسی
Русский
Top Stories
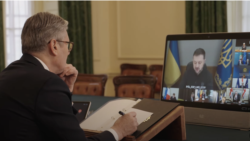
Starmer: ‘Sooner or later’ Russia must yield to peace
Senate averts government shutdown, overcomes Democratic opposition
US to expel South Africa ambassador as relations deteriorate
Kremlin: Reasons to be optimistic about ceasefire deal
VOA UZBEK
Human rights group urges Uzbekistan to uphold reforms
More From VOA
VOA Kurdish
Syria’s interim constitution raises fears of sectarian division
VOA Kurdish
Public release of man’s confession sparks legal concerns
VOA Kurdish
Senior ISIS leader Abu Khadija killed in Iraqi intelligence operation
VOA Russian
Putin tries to punt decision on Ukraine back to Trump
Vatican: Francis stable, out of ‘imminent danger’ of death
Analysts see flaws in Syria's temporary constitution
UN: Iran using drones to enforce hijab law
Chinese officials look to limit social media and screen time in China
From VOA's Language Services
Spanish
El Mundo al Día
Bosnian
Studio Washington
Creole
Pwogram Radyo sou Televizyon
French
Le Monde Aujourd'hui
Persian
اخبار شبانگاهی
Ukrainian
Час-Тайм
Tigrigna
ፈነወ ትግርኛ 1900
Amharic
ከምሽቱ 3:00 ሠዐት የአማርኛ ዜና
Russian
Америка
Persian
روی خط
Ndebele
Live Talk: The Connection
Shona
LiveTalk: The Connection
Zimbabwe English
Live Talk: The Connection
French
Focus Sahel
Persian
ساعت خبر
Dari
صدای شما
Pashto
ستاسې غږ
Afaan Oromoo
Tamsaasa Guyaadhaa Guyyaa
Deewa
د ډیوه د روانو چارو خپرونه په ټي وي
Bambara
Mali Kura
English to Africa
Africa 54
Dari
روایت امروز
Dari
رک و راست
Swahili
Duniani Leo
Pashto
سپینې خبرې
Albanian
Ditari
Deewa
لویه پښتونخوا په ټي وي
Persian
اخبار شامگاهی
Dari
برنامۀ سهشنبه خبری آشنا
Ukrainian
Брифінг Голосу Америки.
45
Videos
29.2
hours of Video
0
Articles
added by 48 language services in the last 24 hours
View More at VOA Global
All About America
The story of Chinese Americans who call Texas home
Other US News
Forecasters warn of tornadoes in US in coming days
Trump vows accountability for those who pursued him in court cases
Can the US pry Russia away from China?
Native American news roundup, March 9-14, 2025
US envoy says Hamas misrepresented release of hostage
Homeland Security, rights group to meet in court over migrants at Guantanamo Bay
VOA Explains
Under what circumstances can a US green card be revoked?
The end of the American penny?
Who pays the price? The ripple effect of Trump’s tariffs
Special Reports
America's trade wars: Past and present
Klamath: America's largest river restoration project
Seychelles: Small nation where big powers compete
Worth Watching
The Inside Story | Episode 187
Border Crossings: Will Moseley
Video
Previous slide
Next slide
Trump intent on imposing global tariffs
Shortage of Marines’ amphibious warships worries top US military officers
China outpacing US in Navy, commercial ship production
Turkey warns Iran against hindering peace deal with Kurdish rebels
Israel's released hostages tell of hunger, torture while in Hamas' captivity
Syrians seek justice for massacres amid humanitarian crisis
Dirt-powered sensors help farmers optimize their fields
Turkey, Israel clash over Syria's future
Columbia University reacts to detention of Palestinian activist
US economy on edge with uncertainty over tariffs
Malawi lions get birth control in effort to save their prey
XS
SM
MD
LG