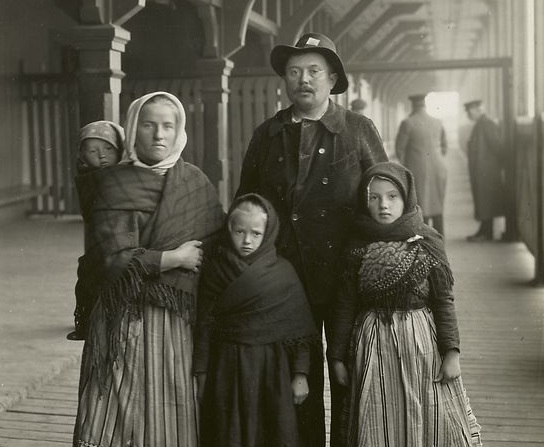
German immigrants – circa 1860 (The Miriam and Ira D. Wallach Division of Art, Prints and Photographs: Photography Collection, The New York Public Library. “Germans.” The New York Public Library Digital Collections. 1860 – 1920)
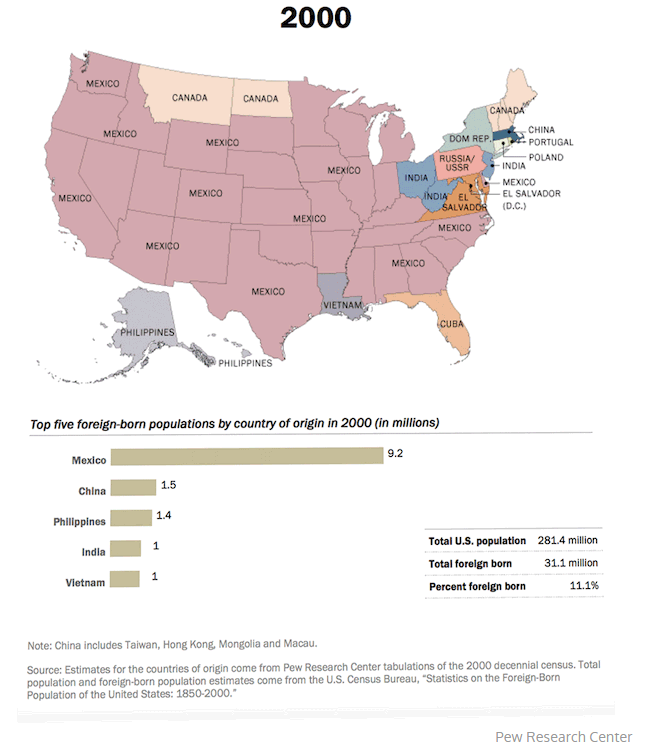
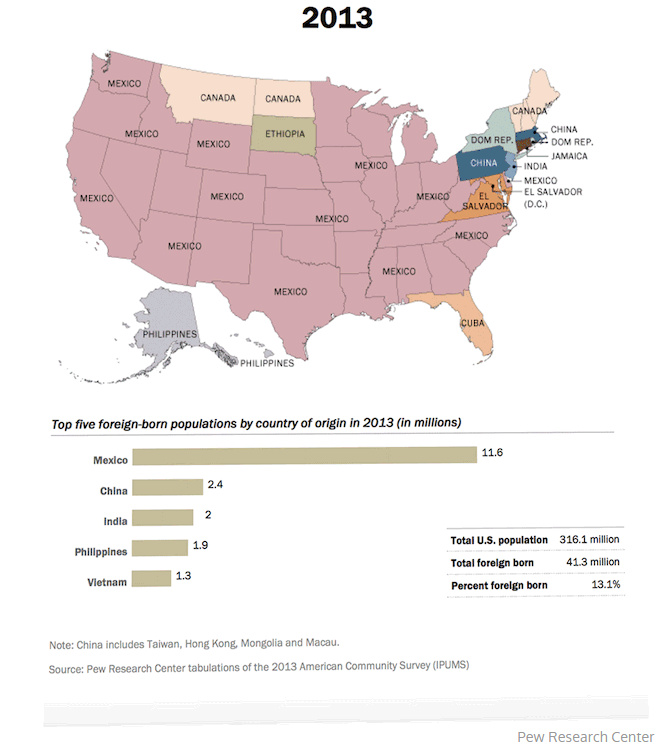
From Ireland and Germany to Italy and Mexico, a new series of maps illustrates changing trends in immigration to the United States from 1850 until 2013.
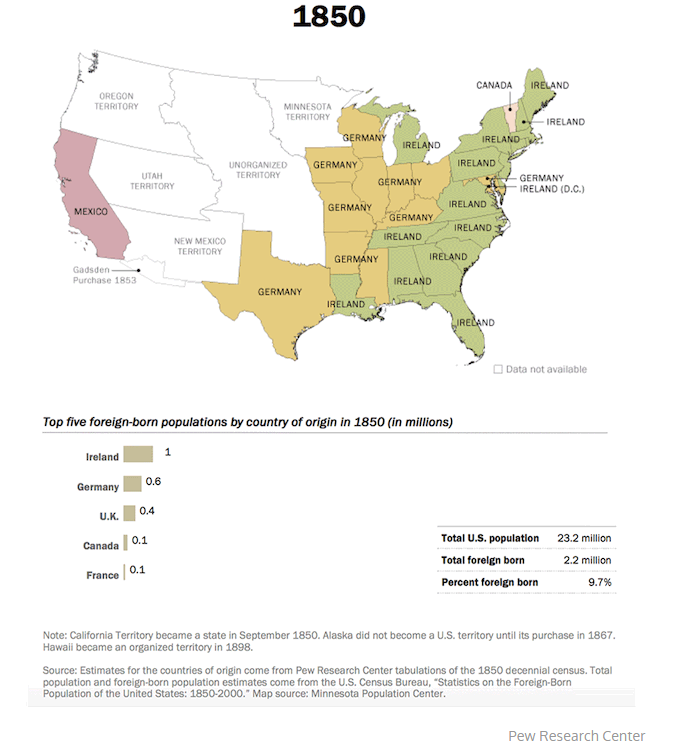
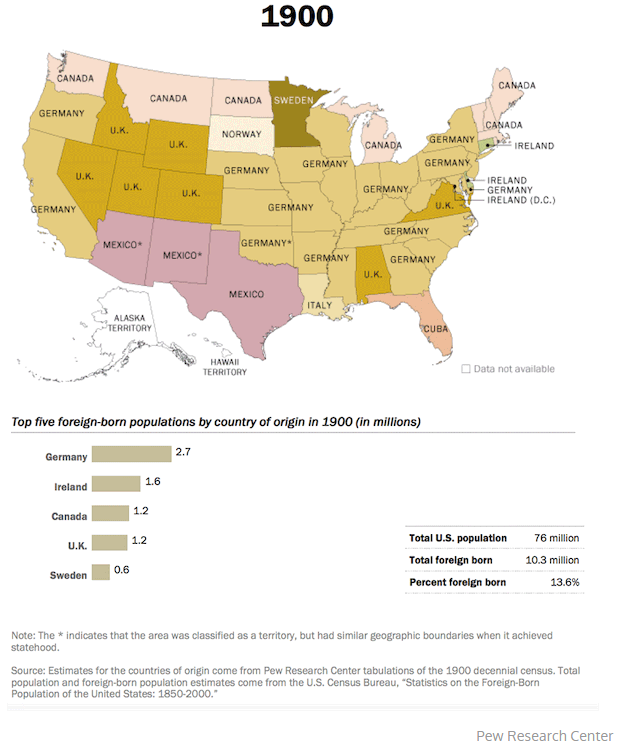
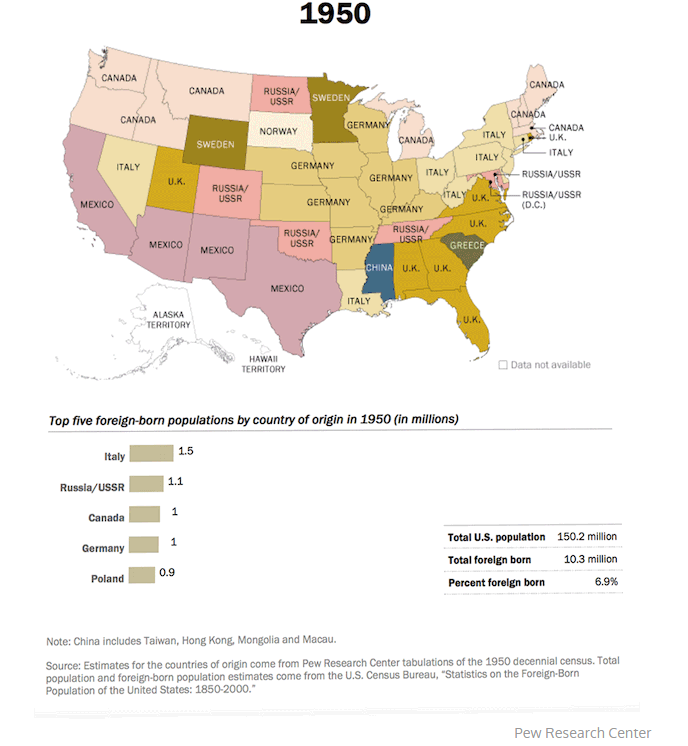
The Pew Research Center graphics show the dominant immigrant groups in each state for every decade during that period.
The country’s first great wave of immigrants arrived from Ireland and Germany. In 1850, the Irish were the nation’s largest immigrant group, settling primarily on the East Coast and in Southern states.
Then came the Age of Mass Migration—from 1850 to 1913—one of the largest migration episodes in modern history, when almost 30 million immigrants moved to the United States.
At the time, American borders were completely open to European immigrants.
By the 1880s, the Germans were the nation’s largest foreign-born group in many Midwestern and Southern states.

An Italian immigrant – date unknown (William Williams papers /Augustus Sherman photographs/New York Public Library)
In 1880, Chinese were the biggest immigrant group in California, Oregon, Washington, Idaho and Nevada.
However, when the Chinese Exclusion Act of 1882 restricted their entry into the United States, other foreign-born groups overtook them in those states.
By the early 1900s, another great influx of immigrants arrived from Southern and Eastern Europe. The 1930s saw Italians become the largest foreign-born group in the country and in nine states, including New York, Louisiana, New Jersey and Nevada.
The make-up of immigrants changed again after 1965. Mexicans became the largest foreign-born group in the country by the 1980s, and by 2013 were the largest immigrant group in 33 states.
Comments welcome. Here are VOA’s guidelines.


I can see there were a lot of immigrants, and that’s because they got problems on their countries.
When did Muslims start migrating to the USA?
Hope never
That’s like saying, ‘When did the Christians start migrating to the USA…” There is no specific ‘country’ for Muslims. They are scattered across the globe within countries like Egpyt, Syria, Morocca, France, Canada, Indonesia, Australia, etc…But to answer your question, the Muslim immigrants came to America (the USA wasn’t a country yet) in the late 1500’s.
Tessa, at least as far back as the 1600’s, so from the beginning.